GUEST UPDATES: Please read for the latest updates on closures impacting our operations. CLICK HERE
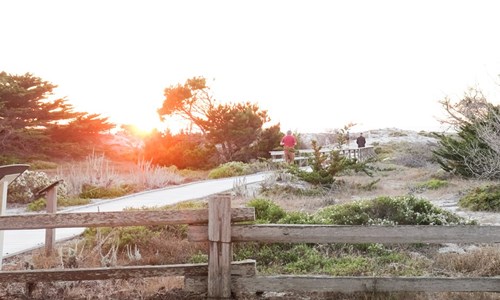
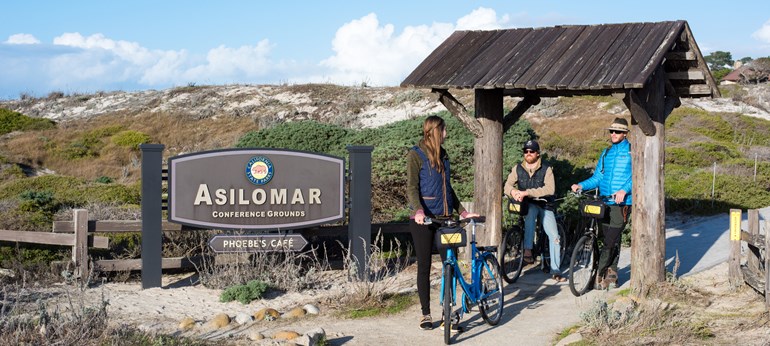
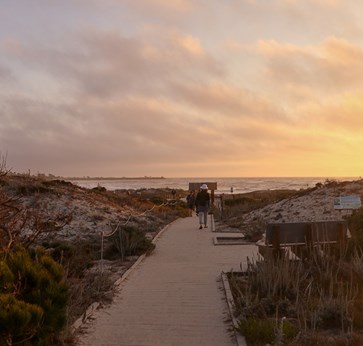
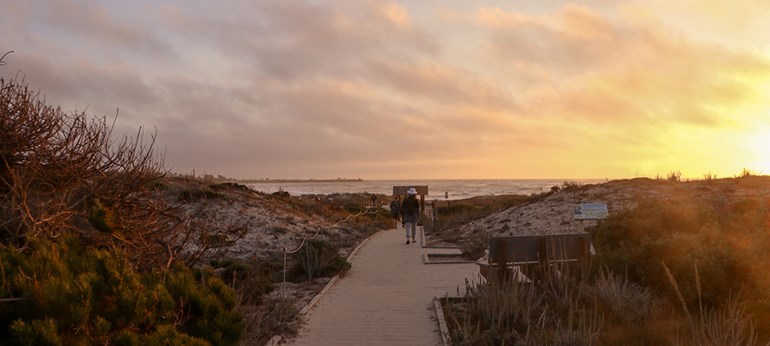
Take a deep breath and settle in for a time of serene relaxation, reflection and rejuvenation. Celebrated as Monterey Peninsula's "Refuge by the Sea" - Asilomar State Beach and Conference Grounds is a breathtakingly gorgeous 107 acres of ecologically diverse beachfront land. Situated within the quaint and scenic town of Pacific Grove, Asilomar offers guests the simple comforts of cozy cottages and historic lodges - and an unforgettable escape from the demands of everyday life.
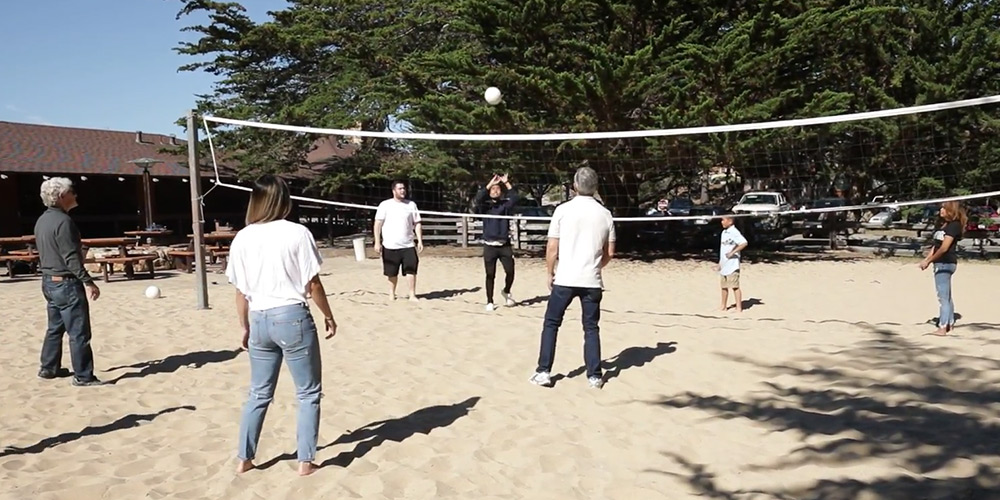
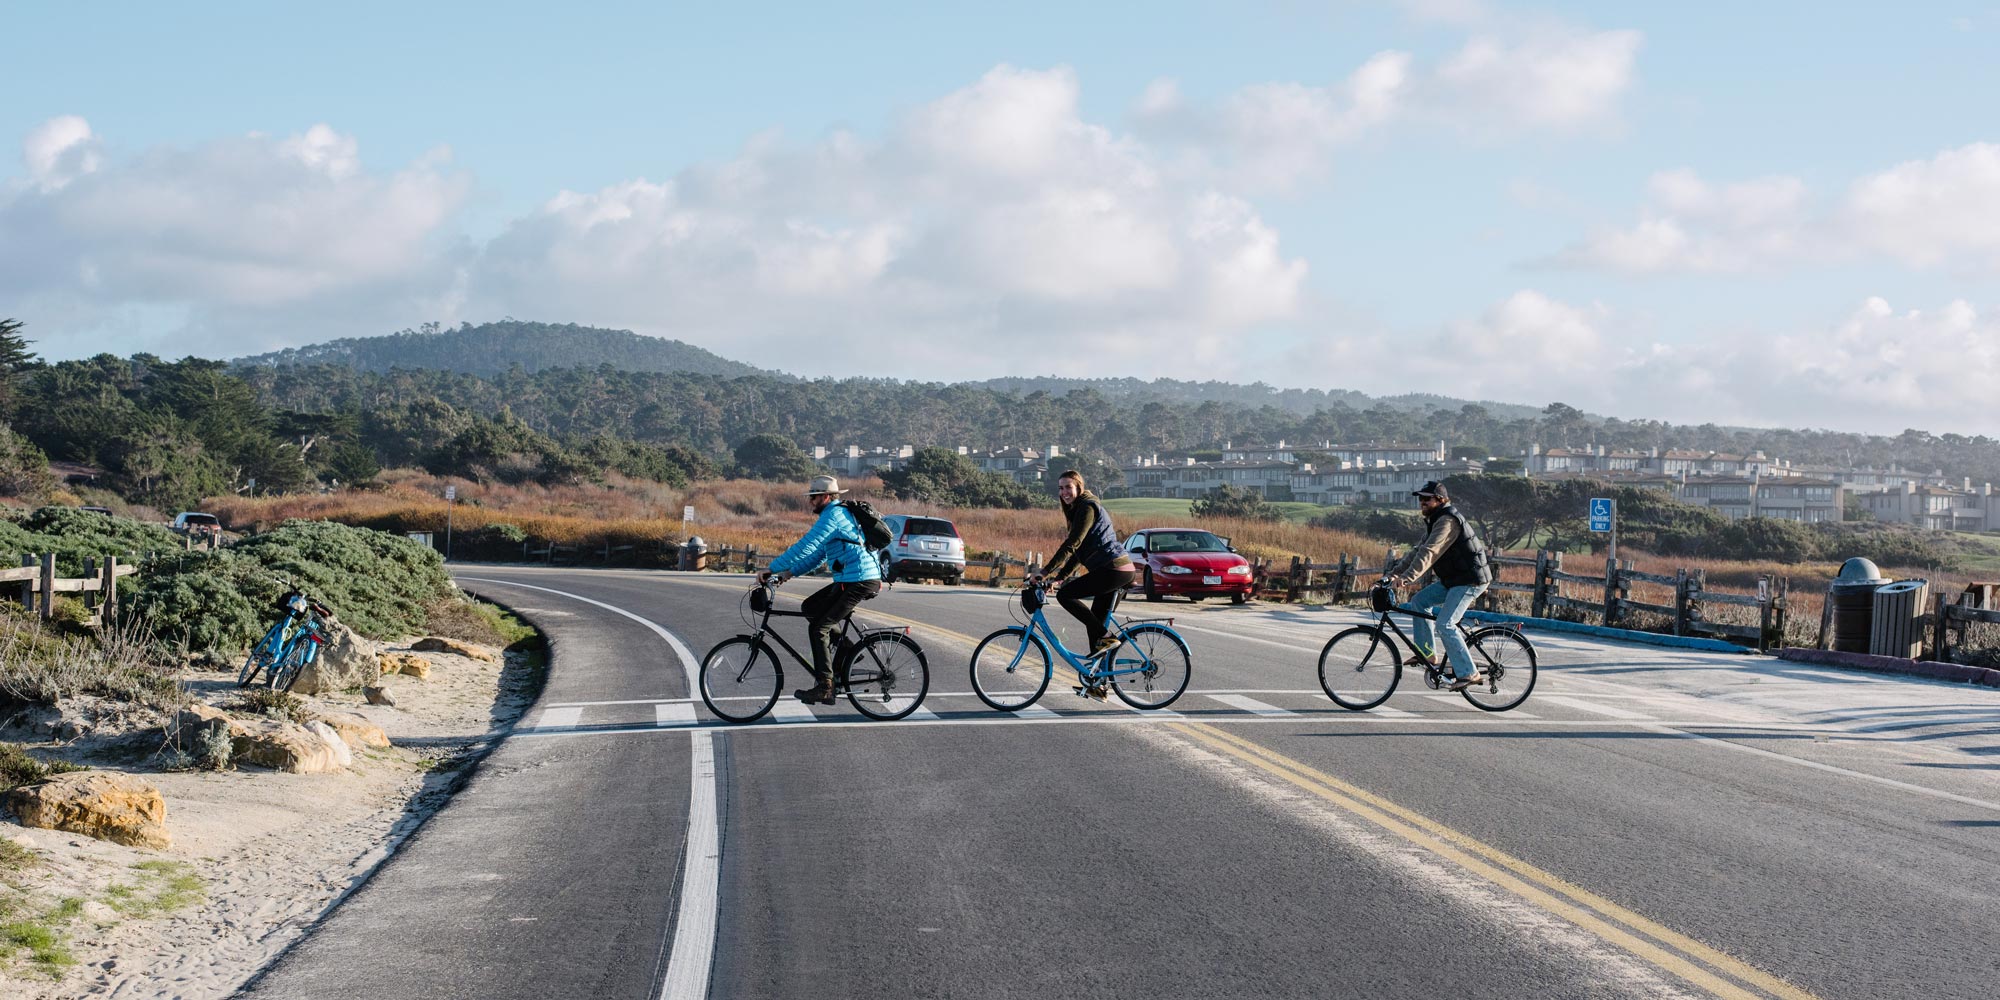
Year-round, you can take part in a vast array of outdoor activities including cycling along miles of beautiful shore or gathering your friends for a fun game of volleyball.
If you’ve never been to Asilomar Hotel & Conference Grounds, it’s helpful to have a plan to ensure you see and do it all.